
在米随随的Blog看到有关Firebug的介绍,遂下载试用了一下,确实是比较好的工具。
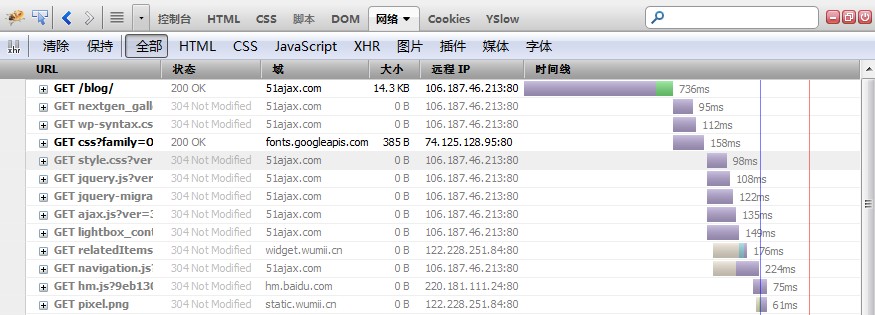
一、效果
二、主要功能
- Inspect and edit HTML
- Tweak CSS to perfection
- Visualize CSS metrics
- Monitor network activity
- Debug and profile JavaScript
- Quickly find errors
- Explore the DOM
- Execute JavaScript on the fly
- Logging for JavaScript
对于WEB开发人员来说,可以非常方便的得到自己想要的信息:HTML、DOM、CSS、JS,甚至各个文件的下载时间。
刚测试了一下JS的调试功能,非常方便,可以设置断点,鼠标移至变量名上,可以得到相应值的提示。太棒了!
三、非Firefox浏览器的解决方案:Firebug Lite
对于非Firefox浏览器,Firebug也有相应的解决方案—Firebug Lite,通过使用console.log()输出错误信息至Firebug 控制台。
1.下载Firebug Lite
下载地址:http://getfirebug.com/releases/firebuglite1.0-b1.zip,解压至WEB目录,比如/js/firebug/。
在页面中增加以下代码:
如果不想安装Firebug Lite,只是为了避免Javascript错误,可以点击这里下载firebugx.js然后copy至代码中即可。
这个文件的代码如下:
if (!(“console” in window) || !(“firebug” in console))
{
var names = [“log”, “debug”, “info”, “warn”, “error”, “assert”, “dir”, “dirxml”,
“group”, “groupEnd”, “time”, “timeEnd”, “count”, “trace”, “profile”, “profileEnd”];
window.console = {};
for (var i = 0; i < names.length; ++i)
window.console[names[i]] = function() {}
}
2.使用Firebug Lite
默认情况下,打开页面后,可以按F12开启Firebug的控制台,如果不想频繁按F12来进入调试状态,也可在HTML元素上增加 debug=”true” ,如下:
3.使用命令行
Firebug也包含一个命令行程序,可以使用以下快捷键Ctrl+Shift+L (or ⌘+Shift+L on Mac)
4.测试页面
按 F12 或 Ctrl+Shift+L,就可以看到效果了。